Few weeks ago we wrote about how to set-up your own web tracking infrastructure and data warehouse with Snowplow and AWS in very cost efficient way, close to if not exactly $1/month. This post is about how to collect Google Analytic events to your own data warehouse using similar approach.
Motivation, why bother
Google Analytics is the most popular web analytic software, it is installed on 67.5% of top 1 million websites according BuiltWith on the date this post is written. Google Analytics is a decent tool if you don’t mid sharing data with Google, however has a big drawbacks: once your website becomes popular enough and you need to analyse significant data sets (over 500,000 sessions for free version at the moment) you start to experience sampling in other than standard reports.
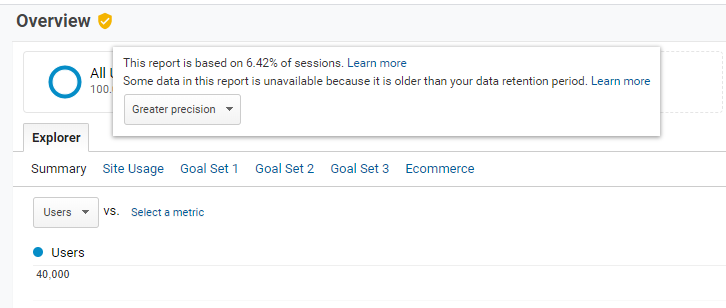
Sampling means that your charts and tables in GA will be based not on all, but randomly generated part of the data, say 20% of all sessions. It may be good enough in some cases, but quite often your analysis may miss important nuances that can be critical for generation business insights.
One way to deal with that is to purchase a paid version of Google Analytics (Analytic 360), in this case your limit of sessions without sampling will be significantly extended, but the price tag (over $100K USD per year) of this solution is hefty for even bigger businesses.
Other way to deal with this is to employ you own solution to collect the data using alternative solution instead of Google Analytics. It gives you benefit of not sharing your business data with Google if you are sensitive to that.
However what if you due to some reason want or have to keep Google Analytics, but still prefer to have the data collected on your own warehouse to analyse bigger data sets without sampling? Fortunately there is a solution – you may collect GA data with Snowplow tracker.
In addition to addressing sampling, having data in your own warehouse in standard SQL form makes it easier to connect you analytical software without extra integration steps.
The process and infrastructure described below is quite similar with just collecting Snowplow events, but with a modified tracking part.
How to collect Google Analytics events to your own AWS warehouse with Snowplow
What do you need to collect GA events with Snowplow to your own AWS infrastructure:
- Google Analytics account
- Google Tag Manager account with container called from web property you tracking
- Your own infrastructure set on AWS
In most cases you should already have Google Analytics account, what you need to do is to modify the way Google Analytics data collection is called. Here is how it can be done.
Step 1. Deploy your AWS infrastructure
We have prepared a Terraform script that creates AWS infrastructure for you. The suggested infrastructure is serverless and very cost efficient.
It includes:
- 3 AWS S3 buckets to store tracking pixel, logs and Athena query result
- Cloudfront distribution with domain name pointing to tracking pixel
- Lambda function to process and enrich the data
- Athena database with saved query that is used to get access to enriched data
You may find that script with deployment instructions in our GitHub repository.
Once you’ve created you infrastructure, make a note of Cloudfront domain name, it should be something like https://abcd12345.cloudfront.net/ You’ll need it on step 2.
Step 2. Configure tracking
Now it is time to change data collection. Snowplow has a Google Analytics plugin, modified version of normal Google Analytics tracking code that sends the events collected not only to Google, but also to your Snowplow endpoint you set on step 1.
Recommended way to deploy this plug-in to keep data quality is via Google Tag Manager, using custom variables.
So you need to create Google Tag Manager account (if you don’t have it yet), with a container for your web property (website) set. The process of setting it is described in Google Tag Manager help section.
We’ll deploy our tracker through that GTM container. Therefor if you previously had your Google Analytics tracking code deployed directly on your page, after the changes you’d better to remove that direct tracking code to avoid collecting the data twice.
OK, assume you have created your GTM account with container. Next step is to make a new Custom JavaScript variable:
- Go to Variables
- In User-Defined Variables section click “New”
- In names set it as “customTask – Snowplow duplicator”. You may use a different name, but important to make a note of it for later use.
- In variable type select “Custom Javascript”
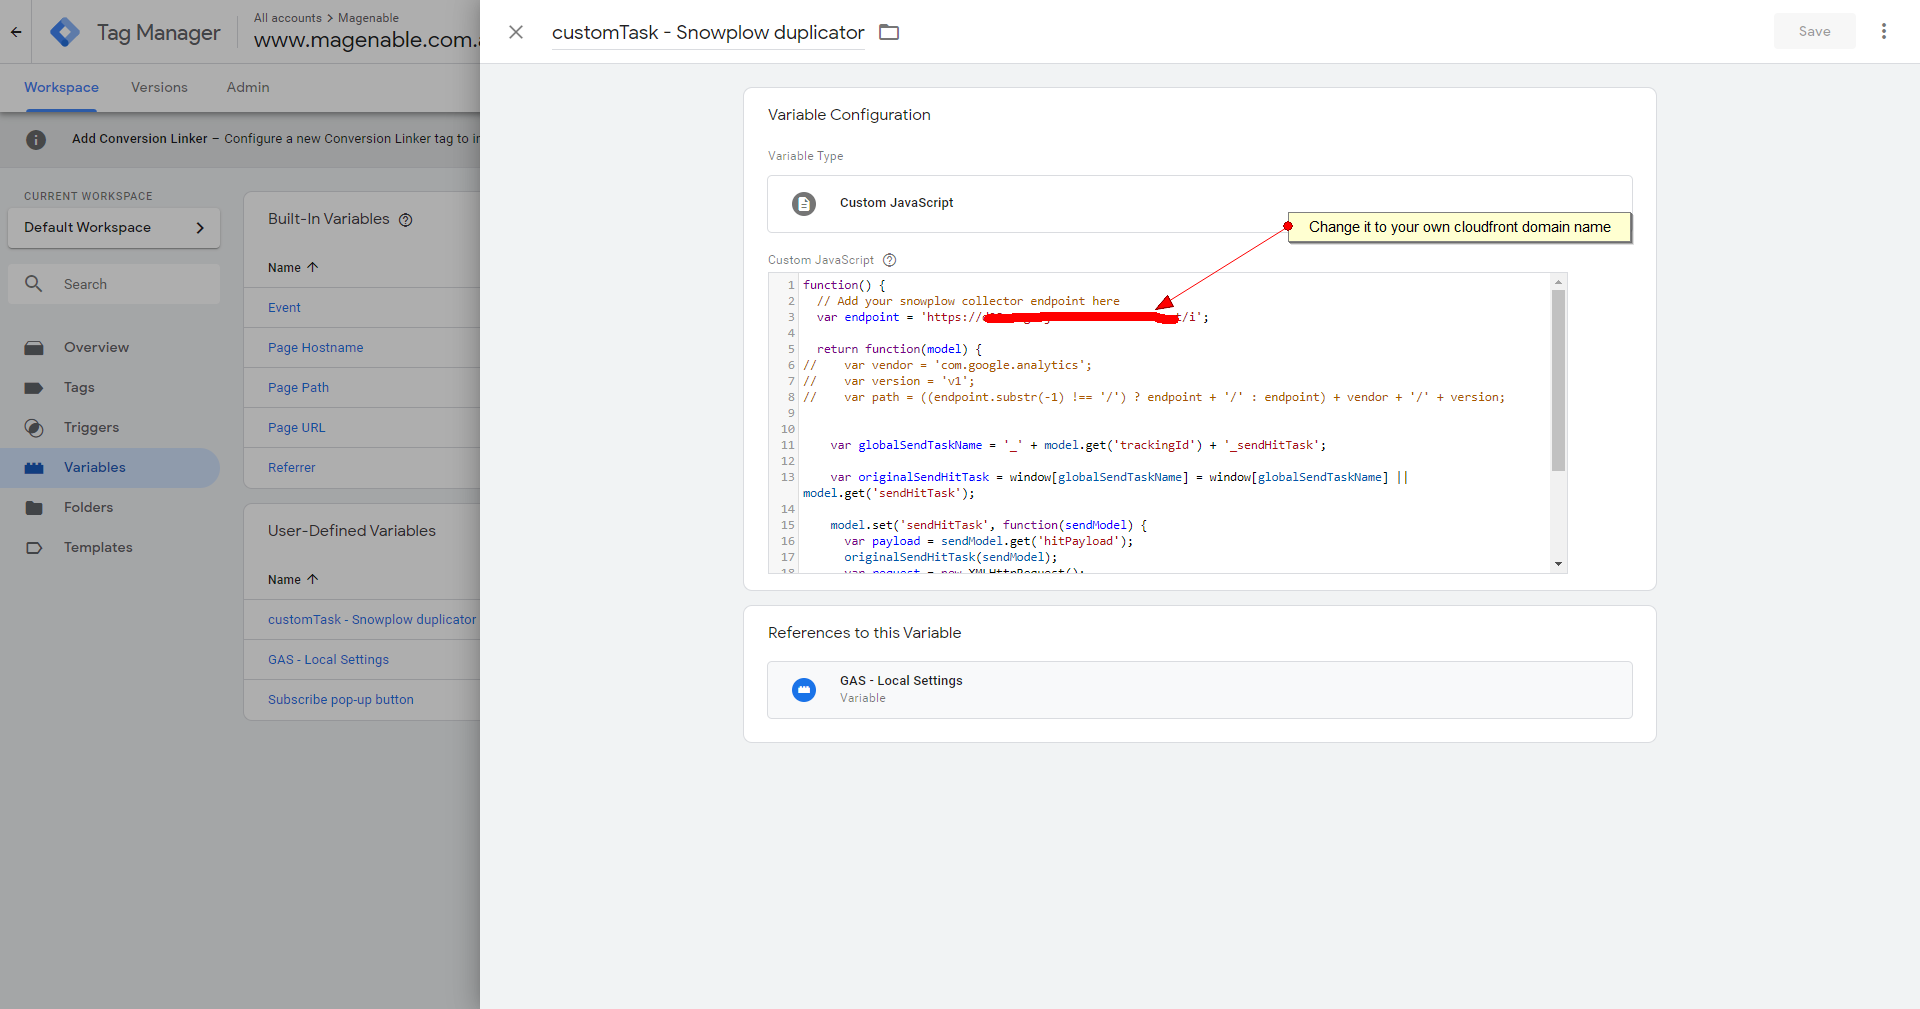
- Paste there code of Javascript function (we have modified a bit default one from plugin repository), changing endpoint to one you created on Step 1.
function() {
  // Add your snowplow collector endpoint here
  var endpoint = 'https://d28zcvgo2jno01.cloudfront.net/i';

  return function(model) {
//    var vendor = 'com.google.analytics';
//    var version = 'v1';
//    var path = ((endpoint.substr(-1) !== '/') ? endpoint + '/' : endpoint) + vendor + '/' + version;


    var globalSendTaskName = '_' + model.get('trackingId') + '_sendHitTask';

    var originalSendHitTask = window[globalSendTaskName] = window[globalSendTaskName] || model.get('sendHitTask');

    model.set('sendHitTask', function(sendModel) {
      var payload = sendModel.get('hitPayload');
      originalSendHitTask(sendModel);
      var request = new XMLHttpRequest();
//      request.open('POST', path, true);
      var path = endpoint + '?' + payload;
      request.open('GET', path, true);
      request.setRequestHeader('Content-type', 'text/plain; charset=UTF-8');
      request.send(payload);
    });
  };
}- Save the variable
Next you need to create “Google Analytics settings” variable:
- Go back to variables section of GTM
- Click new under User-Defined Variables
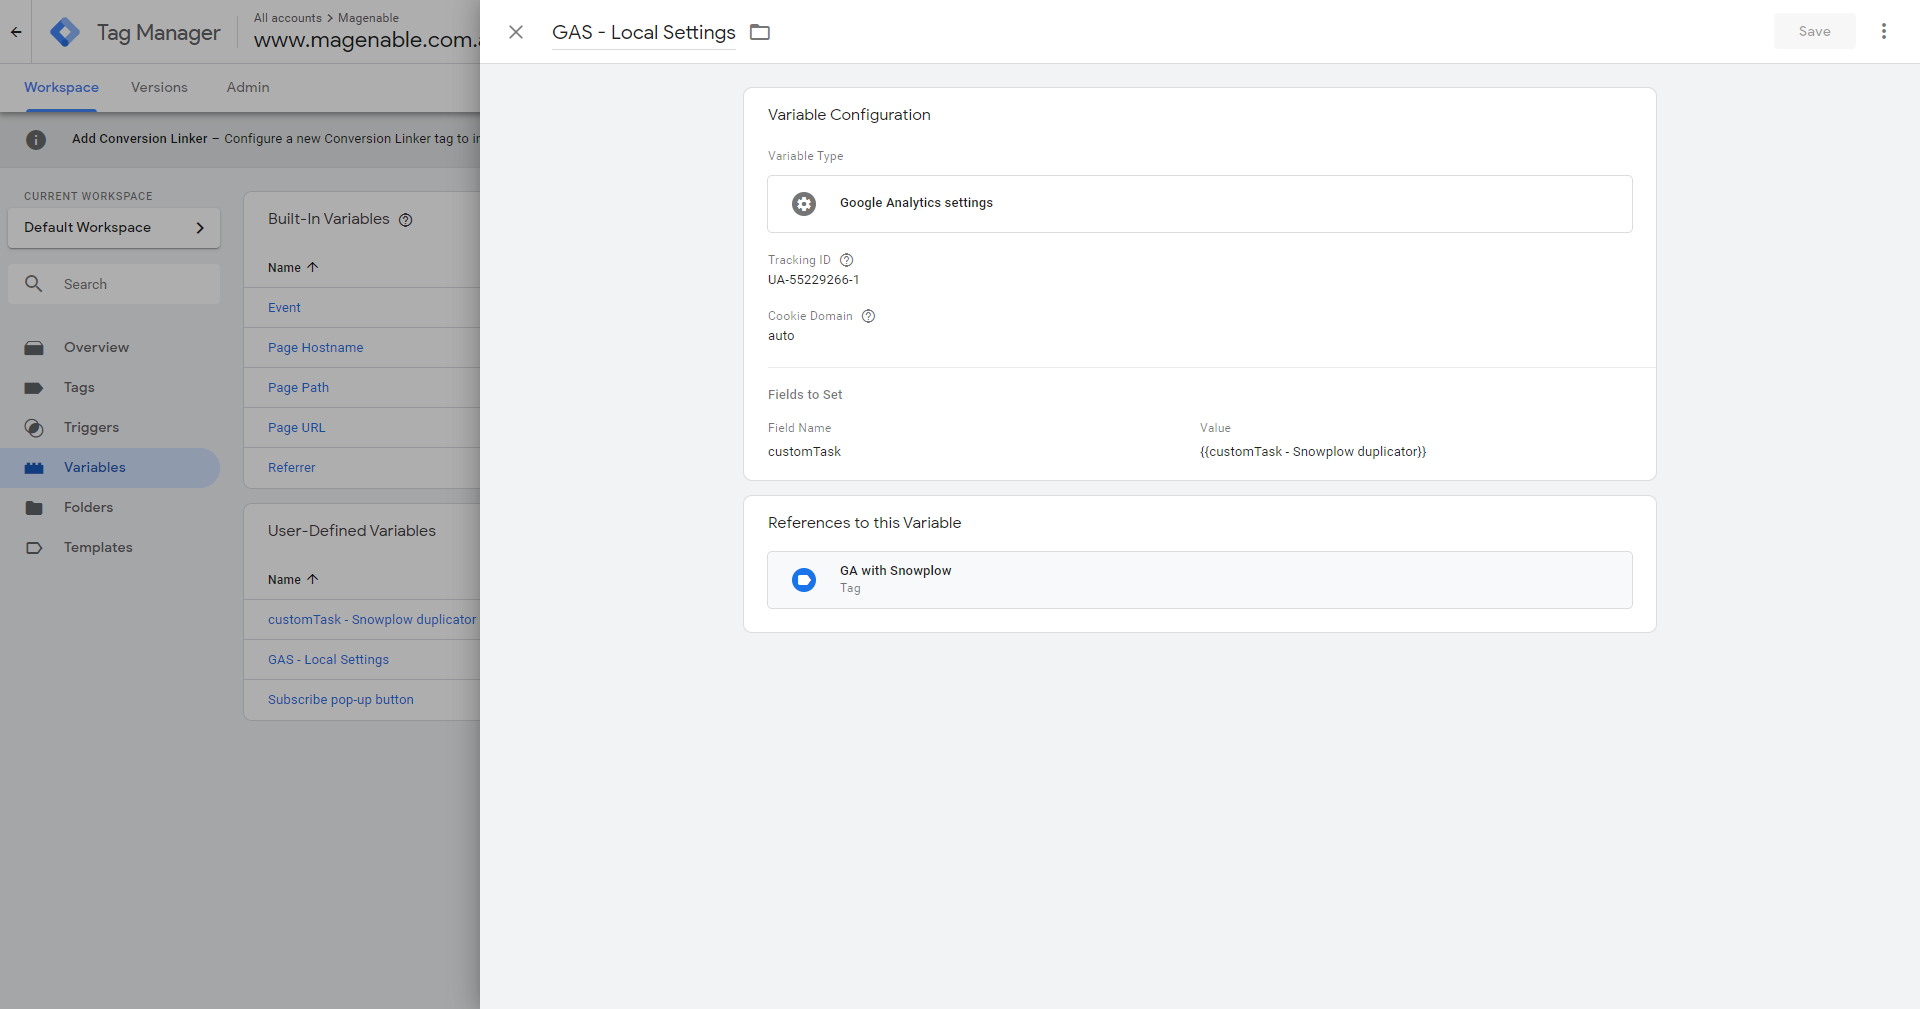
- Define a name (we set it as “GAS-Local Settings”)
- As variable type select Google Analytics Settings
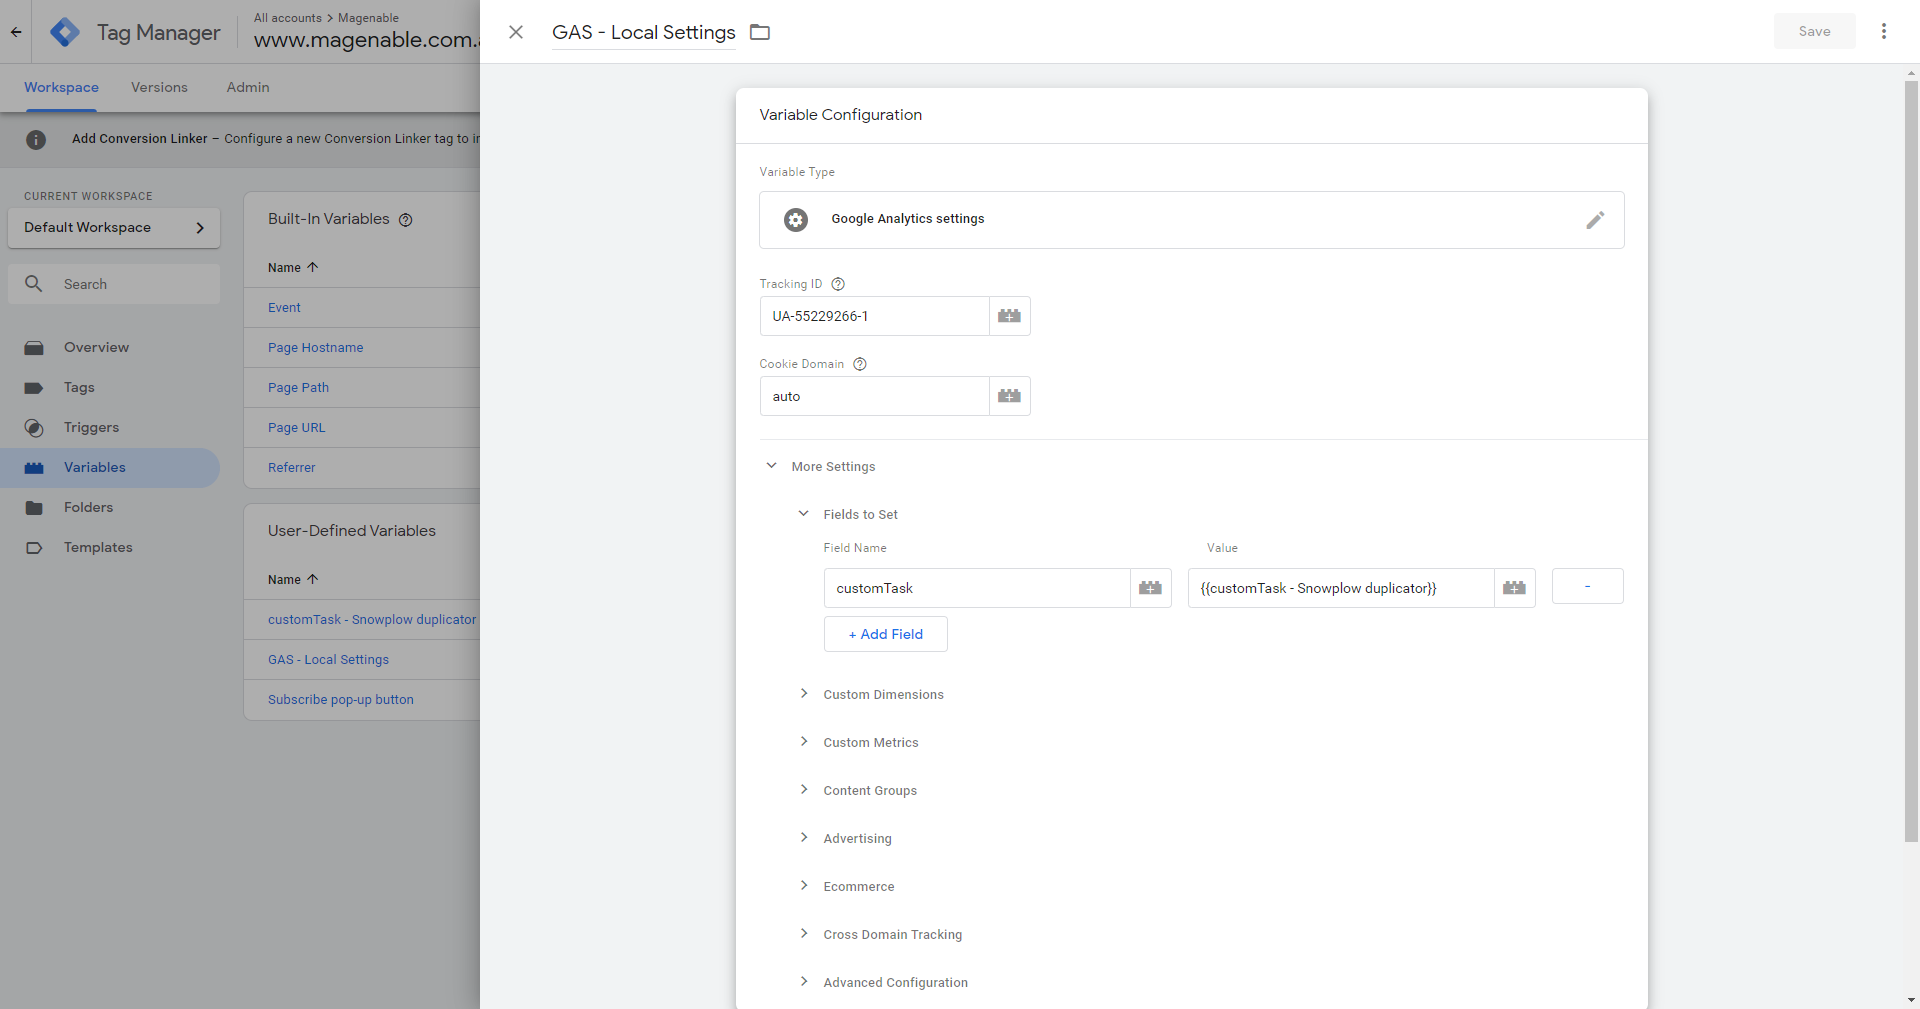
- Set tracking Id (your web property Google Analytics id)
- Go to fields to set
- Make a filed with name “custom task” and define as value name of your custom Javascript function, in our case “{{customTask – Snowplow duplicator}}” (you need to use double curly brackets)
- Save it!
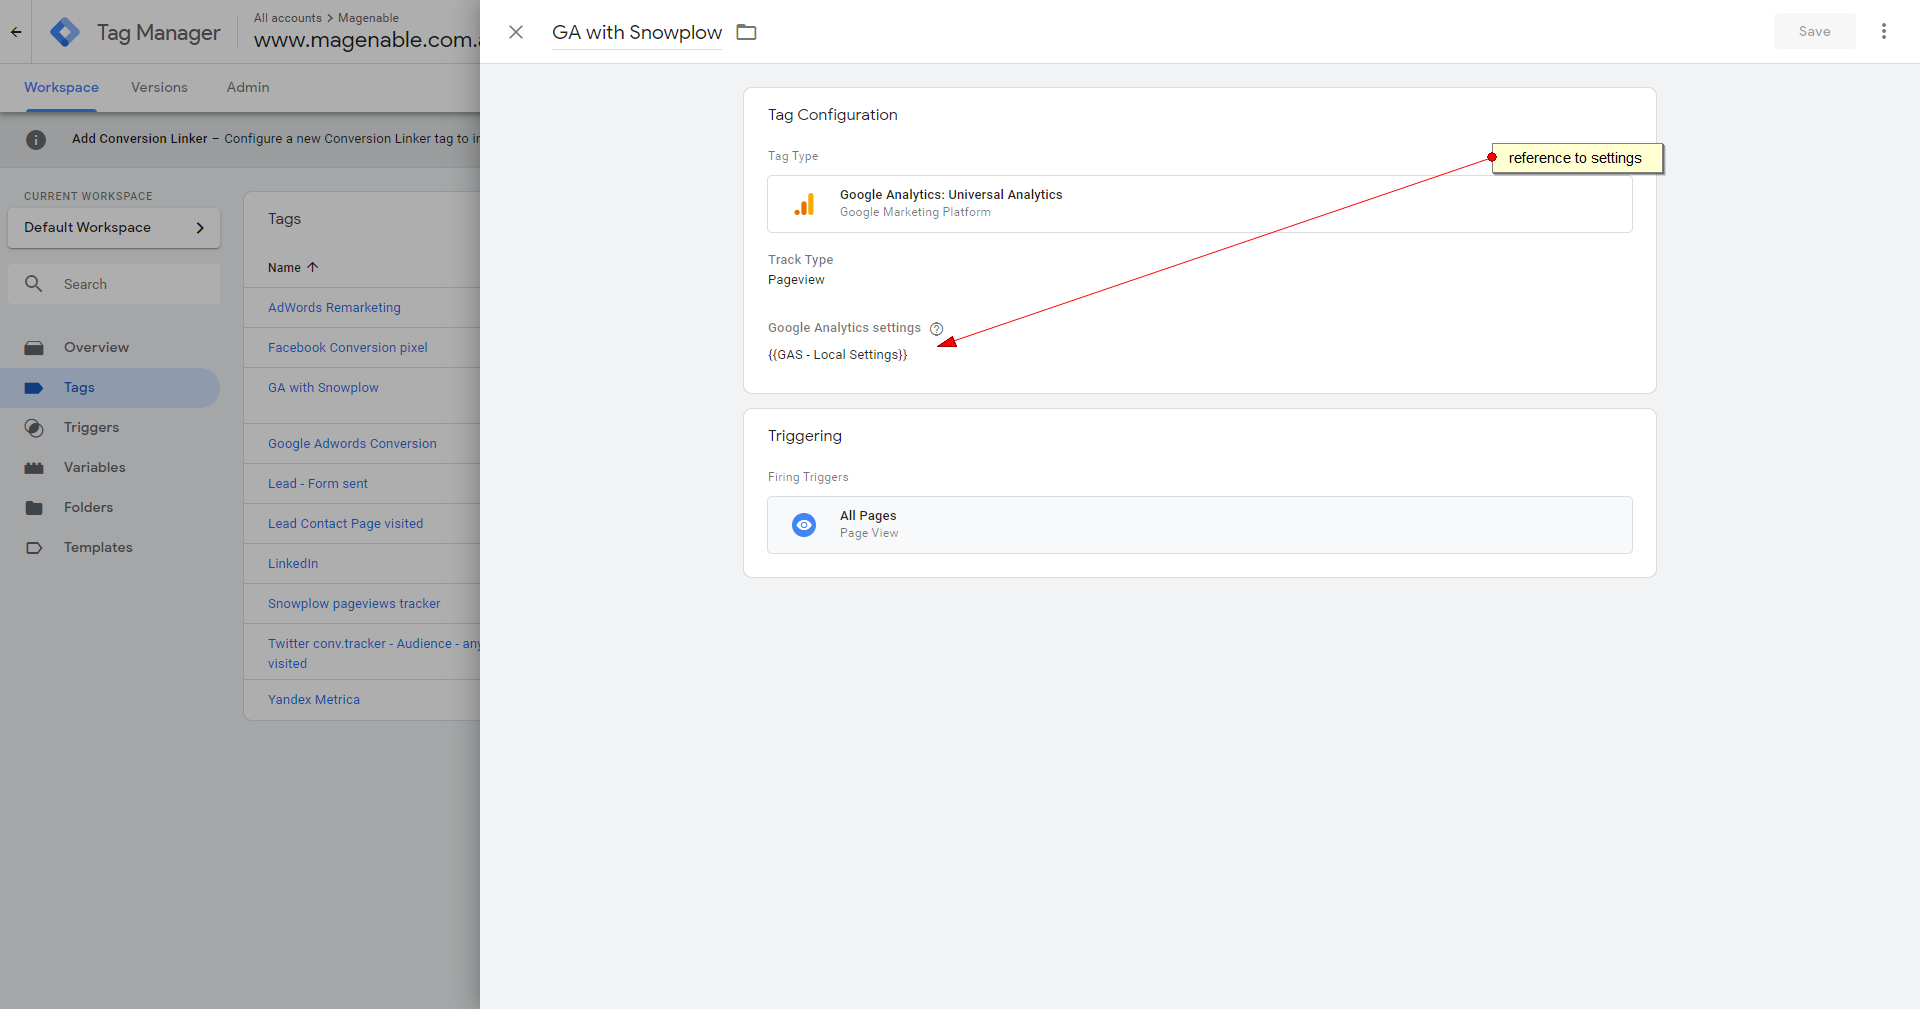
Final step is to modify (or create if you do not use it yet) GTM tag containing call to Google Analytics. What you need to do is to add there reference to just created Google Analytics settings variable as per screenshot below.
That is it! After you publish your GTM the tracking code will start to fire up and send the data not only to Google Analytics, but also to your own data warehouse on AWS.
Lambda function will enrich it and you’ll be able to access the data collected through Athena queries. You may check how to connect to Athena from R in our other post.
The data collected
Let’s have a look to the data collected.
We have imported data to R dataframe, here is the list of columns it has:
colnames(df)
 [1] "protocolversion"      "sdkversion"           "collector_tstamp"     "adsenselinkingnumber"
 [5] "hittype"              "hitsequencenumber"    "documentlocationurl"  "userlanguage"
 [9] "documentencoding"     "documenttitle"        "user_ipaddress"       "screencolors"
[13] "screenresolution"     "viewportsize"         "javaenabled"          "geo_country"
[17] "geo_city"             "geo_zipcode"          "geo_latitude"         "geo_longitude"
[21] "geo_region_name"      "usageinfo"            "joinid"               "trackingcodeversion"
[25] "refr_urlscheme"       "refr_urlhost"         "refr_urlpath"         "refr_urlquery"
[29] "trackingid"           "userid"               "r"                    "gtm"
[33] "cachebuster"          "useragent"            "br_name"              "br_family"
[37] "br_version"           "dvce_type"            "dvce_ismobile"        "geo_timezone"
Note that the most of geo data came here through enrichment process.
With a little bit of data wrangling it is quite easy to build a graph like this, showing number of hits per hour
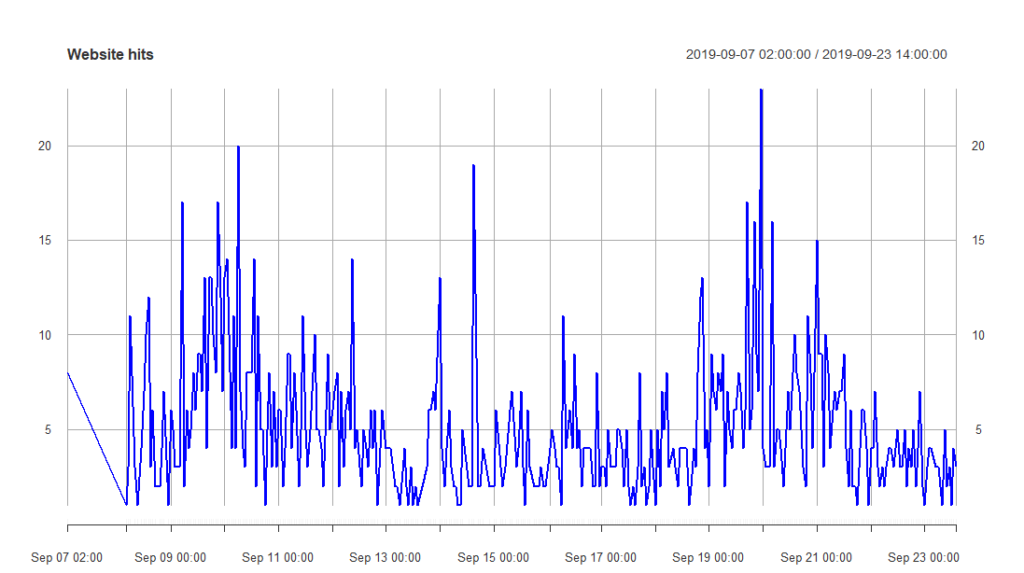
That is just a very simple example, having your data on your fingertips without sampling allows you to do much more sophisticated analysis.
We have published sample R script doing that in our repository or R sample scripts.