Data is proclaimed to be a new oil but still too many businesses miss opportunity related with data and blindly let big tech companies to leverage that asset, leaving too much value on the table.
This website is created with a goal to educate businesses about why data ownership is important and how it can be achieved.
Slack probably doesn’t need a long intro. It is one of the most popular communication tools combining chat, direct messaging and some extra functionality.
If you are sick of hitting limits of SaaS marketing automation platform (from Mailchimp to Eloqua): both technical and business – consider an alternative where you get much more control.
Mautic is the world’s largest open-source marketing automation platform. You can install it on your own hosting and fully control the data it collects.
The server requirements are quite modest, so Mautic can be installed on inexpensive LAMP (Linux Apache PHP MySQL) hosting. It is easy to setup, many hosting providers even let you do it through web-based wizard.
Mautic Capabilities
When I came across Mautic my expectation were not very high, but to my surprise it is quiet powerful platform.
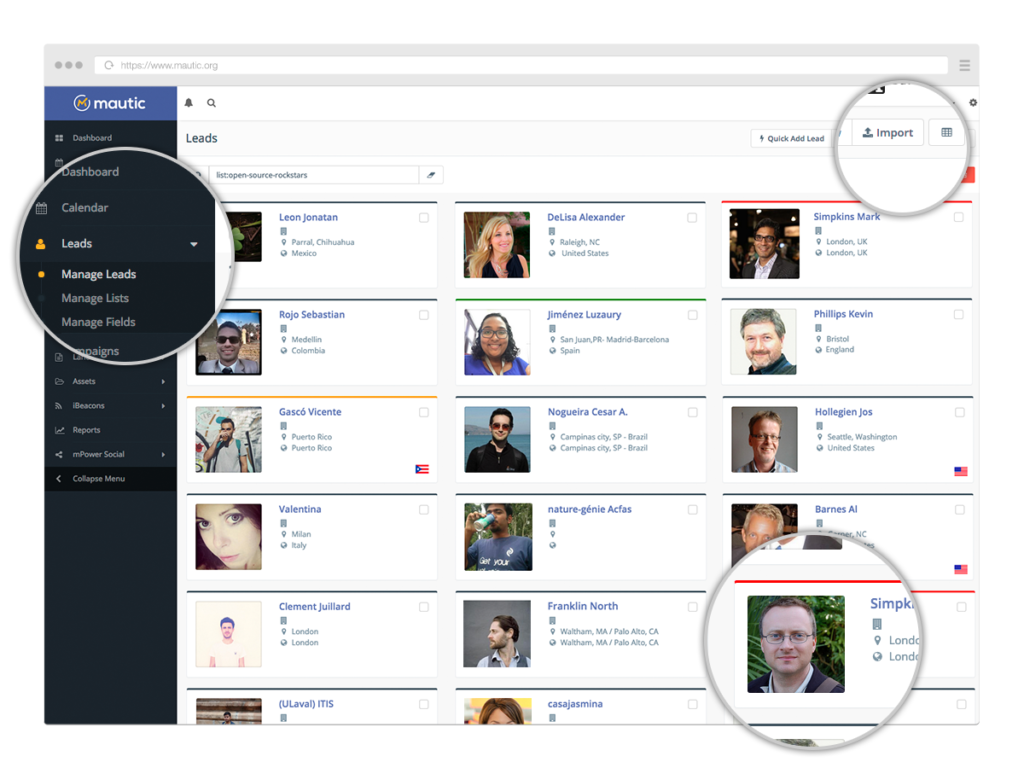
Mautic interface screenshot, credits – mautic.org
The platform has pretty good ratings on comparison websites like GetApp (4.3/5) and Capterra (4.5/5)
In one sentence Mautic helps you organise your marketing campaign, automate the process of finding leads, nurture them and reach with your marketing messages through various channels and track the whole process. And all that is free with self-hosted open-source edition!
Lead collections and nurturing
With Mautic you can create landing pages, forms to embed on your existing websites and integration with other systems (like your CRM) through API. Plus track the activity of the leads from website activity to emails opens. The information is stored in contact database, so you have holistic overview of particular person behaviour across various tracked channels.
Campaigns
Similar with many email marketing software you can use Mautic to run email campaigns like sending your newsletter. The audience for your newsletter can be segmented based on various parameters.
In addition to broadcast campaigns you may set automated, ones that trigger based on certain actions.
In addition to email Mautic also supports web and mobile notifications, text messages and tweets as channels.
Social media
Mautic has also capability to listen social media channels (like Twitter), which helps your business to keep track on the conversations around relevant topics (hastags) and personalities.
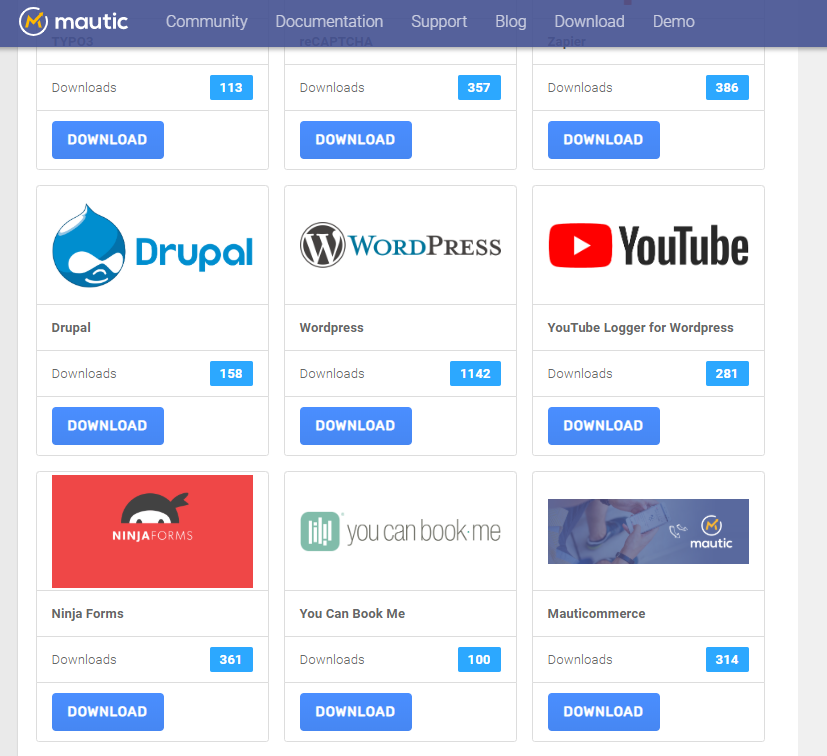
Ecosystem
The core capabilities are supported through 3rd party apps/plugins that you can install from Mautic Marketplace. There are plugins to integrate Mautic with popular CMR like Pipedrive or vTiger, content management systems including WordPress, Drupal and Typo3
Where is my data
Mautic stores the collected data in standard MySQL database. That means that you can easily transfer that data to your data warehouse and use it on conjunction with other data sources like web analytics or CRM.
Interested to have a closer look?
Check Mautic product tour page with download link. Or ask your hosting provide is it available for easy installation.
Few weeks ago we wrote about how to set-up your own web tracking infrastructure and data warehouse with Snowplow and AWS in very cost efficient way, close to if not exactly $1/month. This post is about how to collect Google Analytic events to your own data warehouse using similar approach.
It’s September now, so good time to check what was the real cost to run our Snowplow/AWS website visitors tracking set-up.
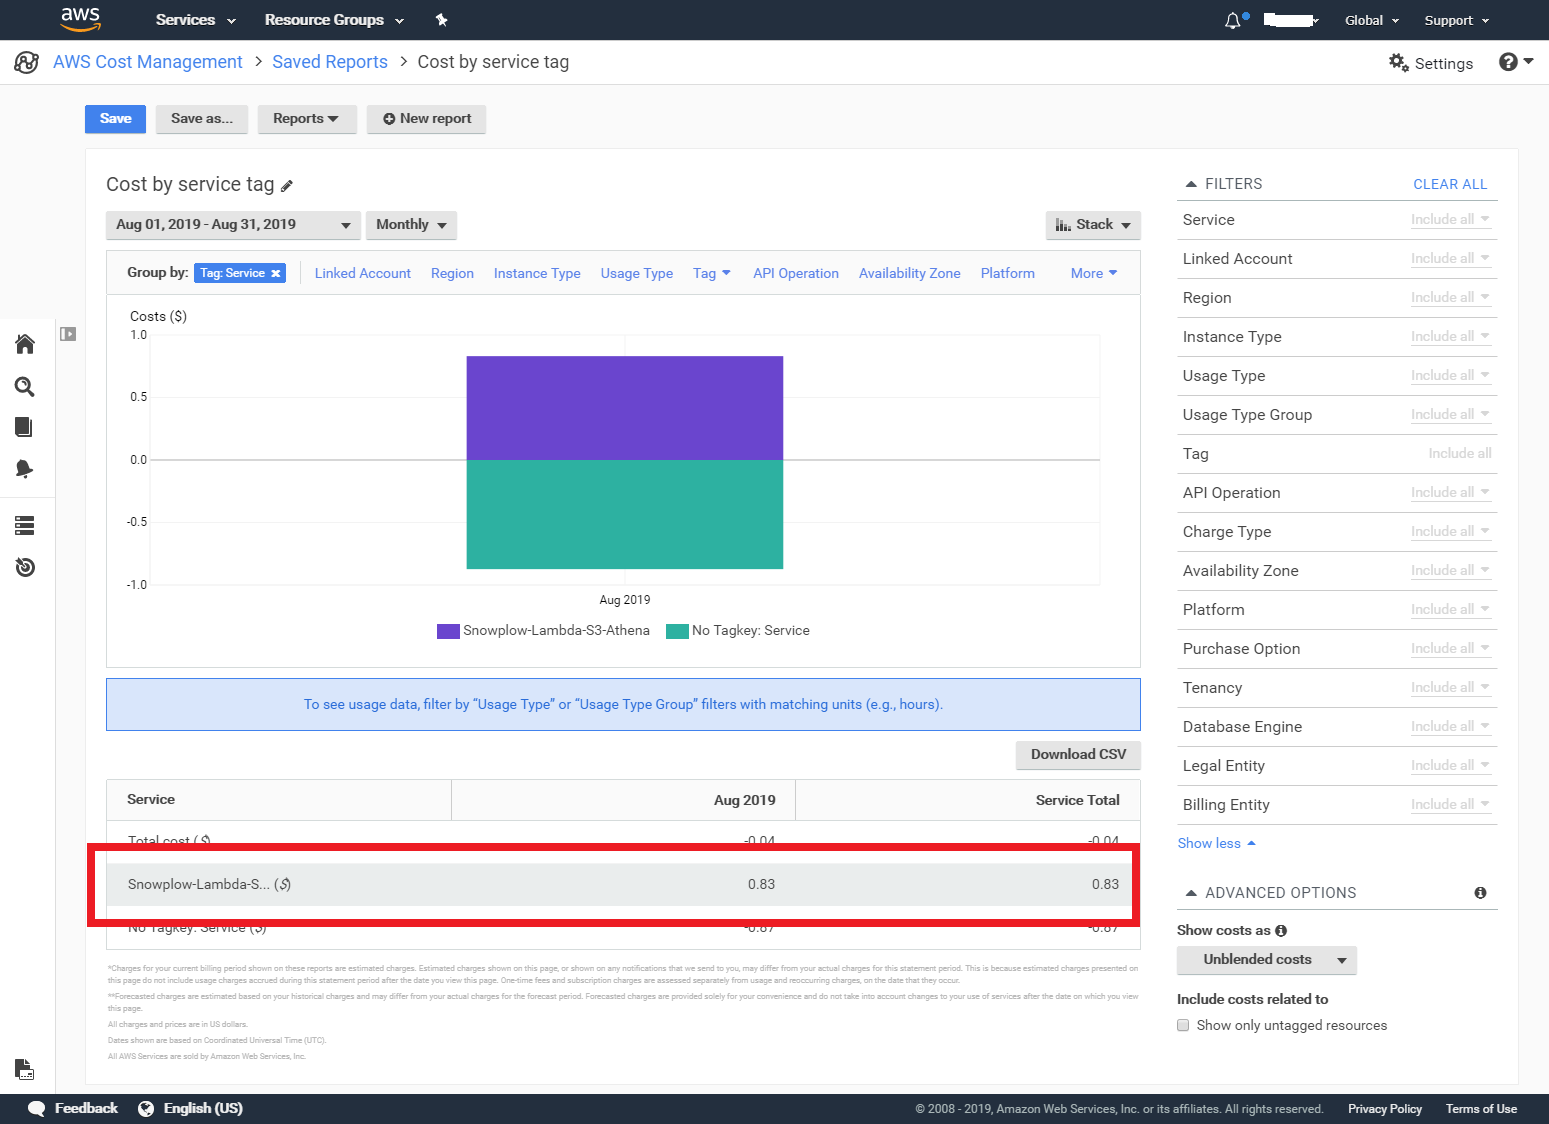
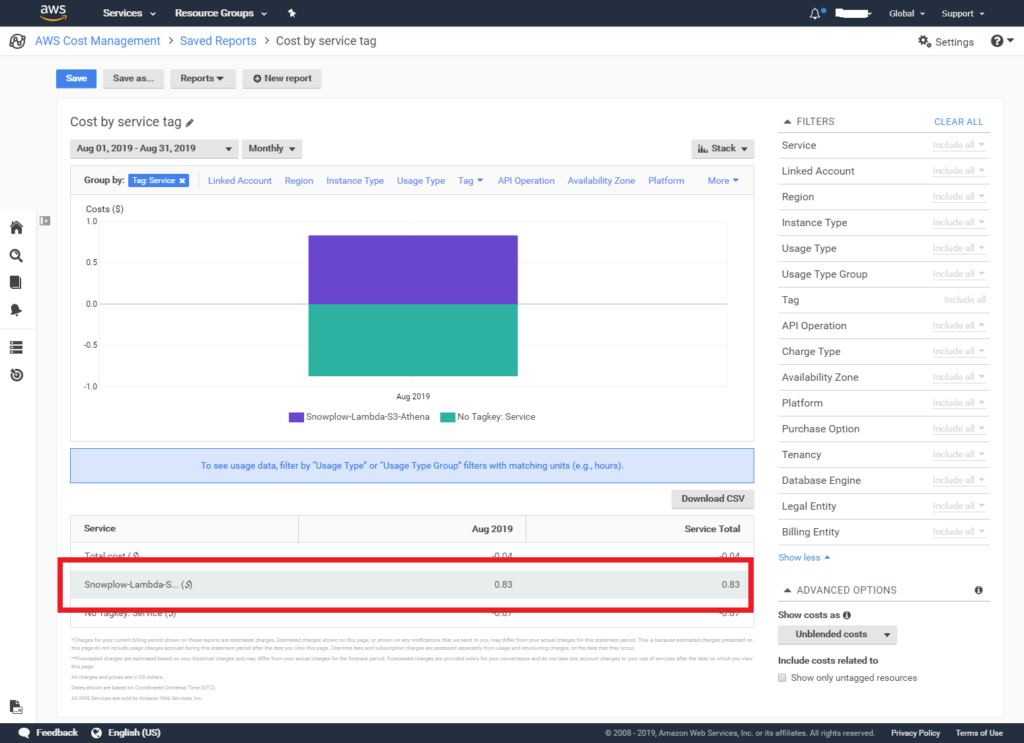
When we set-up our AWS environment, we created a service tag for billing to track all costs related with our solution: S3, Cloudfront, Lambda, Athena. Here is what we got for this tag for August:
Cost of Snowplow tracking
As you see we ended up with $0.83 costs involved in tracking, indeed less than one dollar.
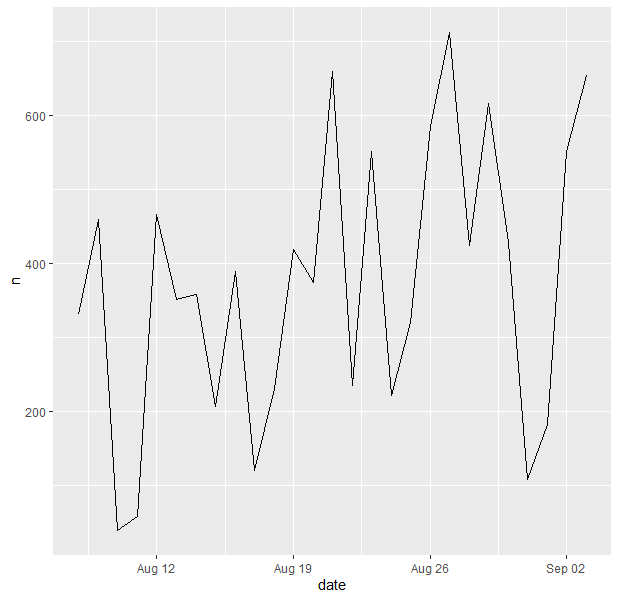
To be totally fair time period was a bit less than month, the data started to be properly collected Aug 9th, but still the claim of $1/month infrastructure cost was met if not literally, but close by. Tracked website generated 10077 events over that period of time.
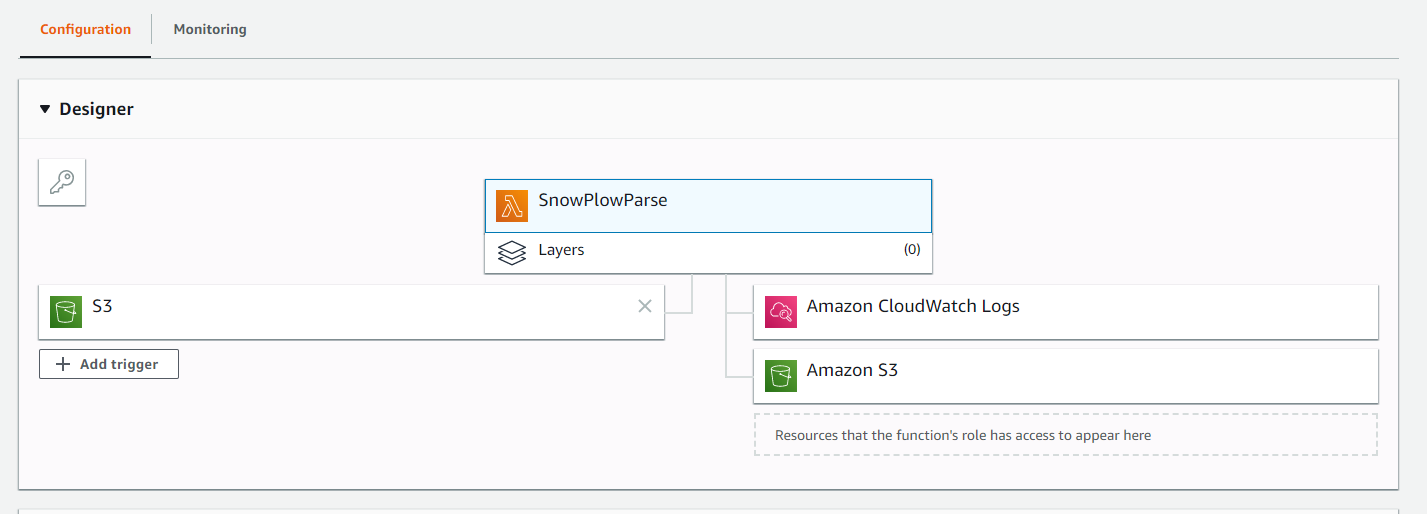
We previously wrote about how to collect website data with Snowplow Analytics, save it to AWS S3, process and enrich with Lambda function and retrieve with AWS Athena.
In this post I’ll write about how to access this data through one of the most popular languages used in data science R.
AWS
Athena query result location
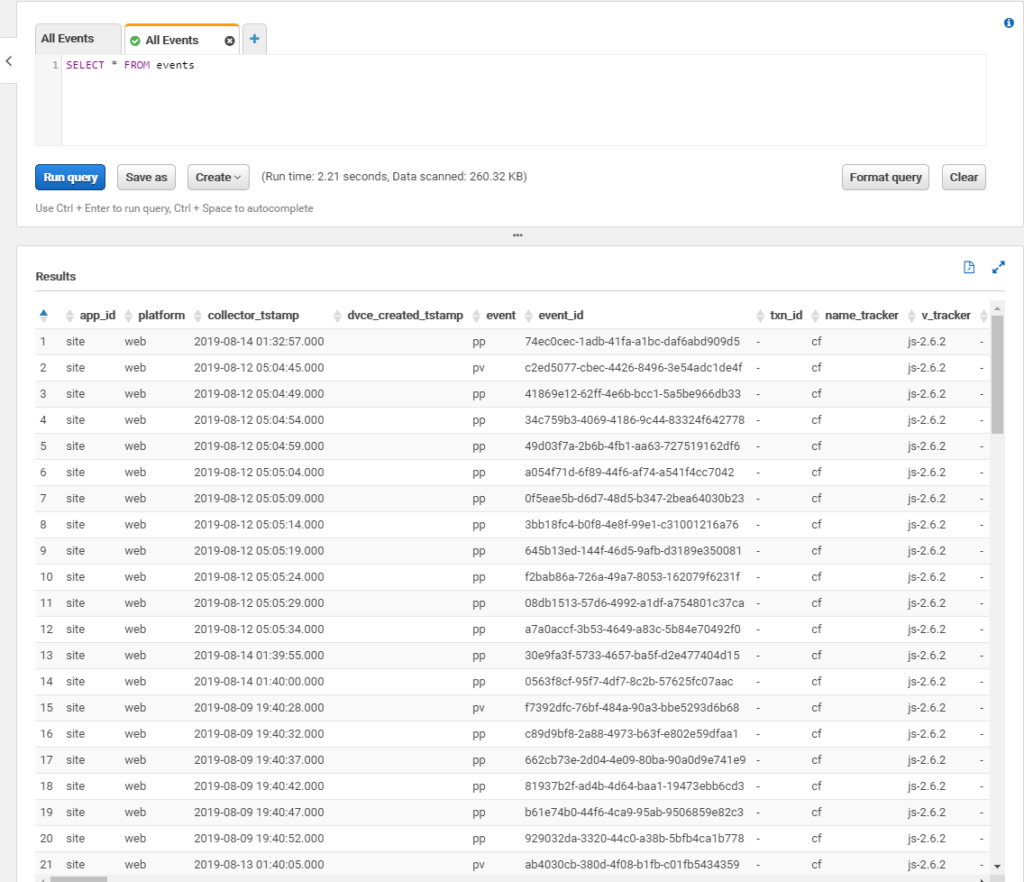
Assume you have your AWS Athena configured, it can query processed data. In this case you should see something like that if do a basic select query.
AWS Athena query result: web site events collected with Snowplow
Go to Settings icon on top (not on the screenshot) and click there.
You’ll see a pop-up with Settings. Find what is in Query result location field, it should be something like s3://query-results-bucket/folder/ and copy it for future use.
AWS API user and policy
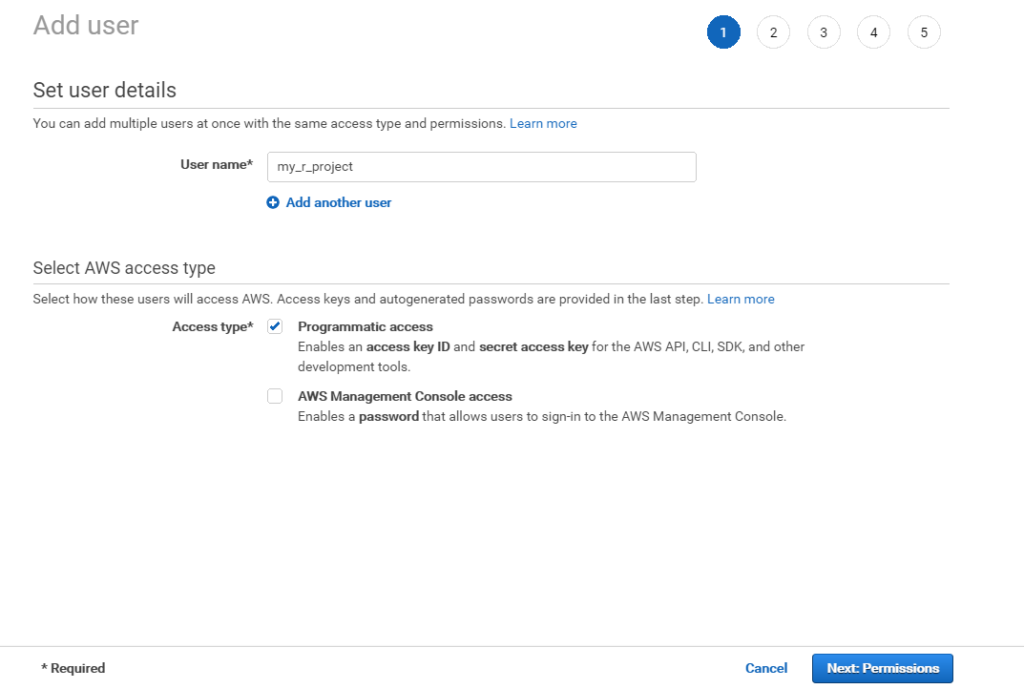
Next you need to create an API user and attach to this user an appropriate policy that allows to work with S3 and Athena. You need create user with programmatic access, because we plan to get access to Athena via API.
Programmatic user creation
Then attach to this user policy, just enough to work with S3 resources where you store your data. You may find a policy that we used below:
Under resource you should put your AWS bucket containing Athena files. You may use wildcard like my-bucket-* if you have multiple buckets and want to access all of them.
Finally, once the process is finished record API access key ID and secret access key, copy it somewhere for future use.
Once you have your keys, the best way to use them is to set them in your local environment. It can be done through AWS CLI (assume it is installed on your machine) with ‘aws configure” command.
You have just copied your access key ID and secret.
If you deed all things right, AWS credentials will be stored in your local environment and can be used from R. More details about the process can be found in AWS documentation.
R side
There is a wrapper package that developed by Neal Fultz and Gergely Daróczi that makes it easier to connect to AWS Athena from R. It is called AWR.Athena. You can find it on CRAN and Github.
You’ll also need DBI package to work with Athena, plus we’ll use tidyverse for data manipulation and visualisation in our example.
The code below set a connection with Athena. S3OutputLocation should be taken from what you copied from your Athena settings. If you see error when trying to do that request, most probably your API user has wrong permissions.
con <- dbConnect(AWR.Athena::Athena(), region='us-west-2',
                 S3OutputLocation='s3://aws-athena-query-results-518190832416-us-west-2/',
                 Schema='default')
If all went well you can start query the database
# get list of tables available
dbListTables(con)
#query specific table
df <- as_tibble(dbGetQuery(con, "Select * from events"))
As a result of the last command we now have all events collected in a tibble called df. I have just installed collection few days ago and the website where the tracking implemented isn’t extremely popular, so the size of resulting data isn’t an issue. If you use it in wild and with popular website, you may consider limit the data from certain date.
df1 <- as_tibble(dbGetQuery(con, "SELECT * FROM events WHERE DATE(collector_tstamp) >= DATE('2019-08-12')"))
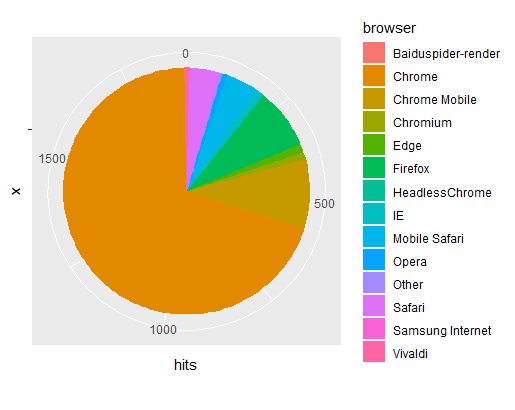
Let’s now make a basic visualisation of the data using ggplot. What browsers did our website visitor use?
We see that the most popular browser is Google Chrome (to no surprise).
That is very simple example, just scratching the surface of what is possible to do with R. The possibilities are endless. To get full source code (with some extra examples) you can visit our Github page.
Suppose you like “own your business data” concept, but how does it work in practice? What are the tools that can be used and importantly don’t make your CFO (if you have one) cry?